The Design of Athletic Fields and the Role of Life Cycle Cost Analysis
As institutions look to maximize facility efficiency and identify new revenue streams, life cycle analysis delivers informed planning decisions.
Higher Education Funding & Revenue Streams
After tuition and philanthropy, sports represent the third leading revenue stream for most universities and private secondary schools across the United States. This funding comes not only from ticket sales, but also from the fees and dues generated from intercollegiate, intermural and community league organizations. In consideration of the changing dynamics between schools and the communities in which they reside, engaging local stakeholders through sports has become an increasingly effective way to integrate an institution into the local fabric, while generating additional capital for other uses.
OCMI works with owners, architects, engineers and contractors as a truly collaborative project partner to inform planning decisions. We analyze upfront capital investments and contextualize the data against estimated maintenance costs, anticipated revenue streams, and relative user experiences.
Case Study: Turf vs. Sod
Serving as the Owner’s Representative and working with the design-build team, OCMI studied the feasibility of renovating a school’s existing athletic fields to bring on new uses and get the complex up to ADA compliance. The existing facilities had fallen into disrepair, with complicated soil conditions leading to far-below acceptable field conditions. Initial budgets precluded the installation of an artificial turf football/soccer field, as the upfront costs exceeded the approved budget.
In response to the project realities, OCMI first developed a survey to quantify and understand non-student (staff, teachers, community members) interest in the athletic facilities, identifying the current challenges perceived by all stakeholders. From that survey, it became clear that a key need for non-student stakeholders was the incorporation of an artificial turf field (versus natural grass).
From there, OCMI studied and quantified both the upfront and long-term costs of a natural grass field and an artificial turf field. Our findings revealed that while in this case installation of an artificial turf field would cost roughly 150% more than natural grass, the 20-year maintenance costs of natural grass was nearly 250% that of artificial turf.
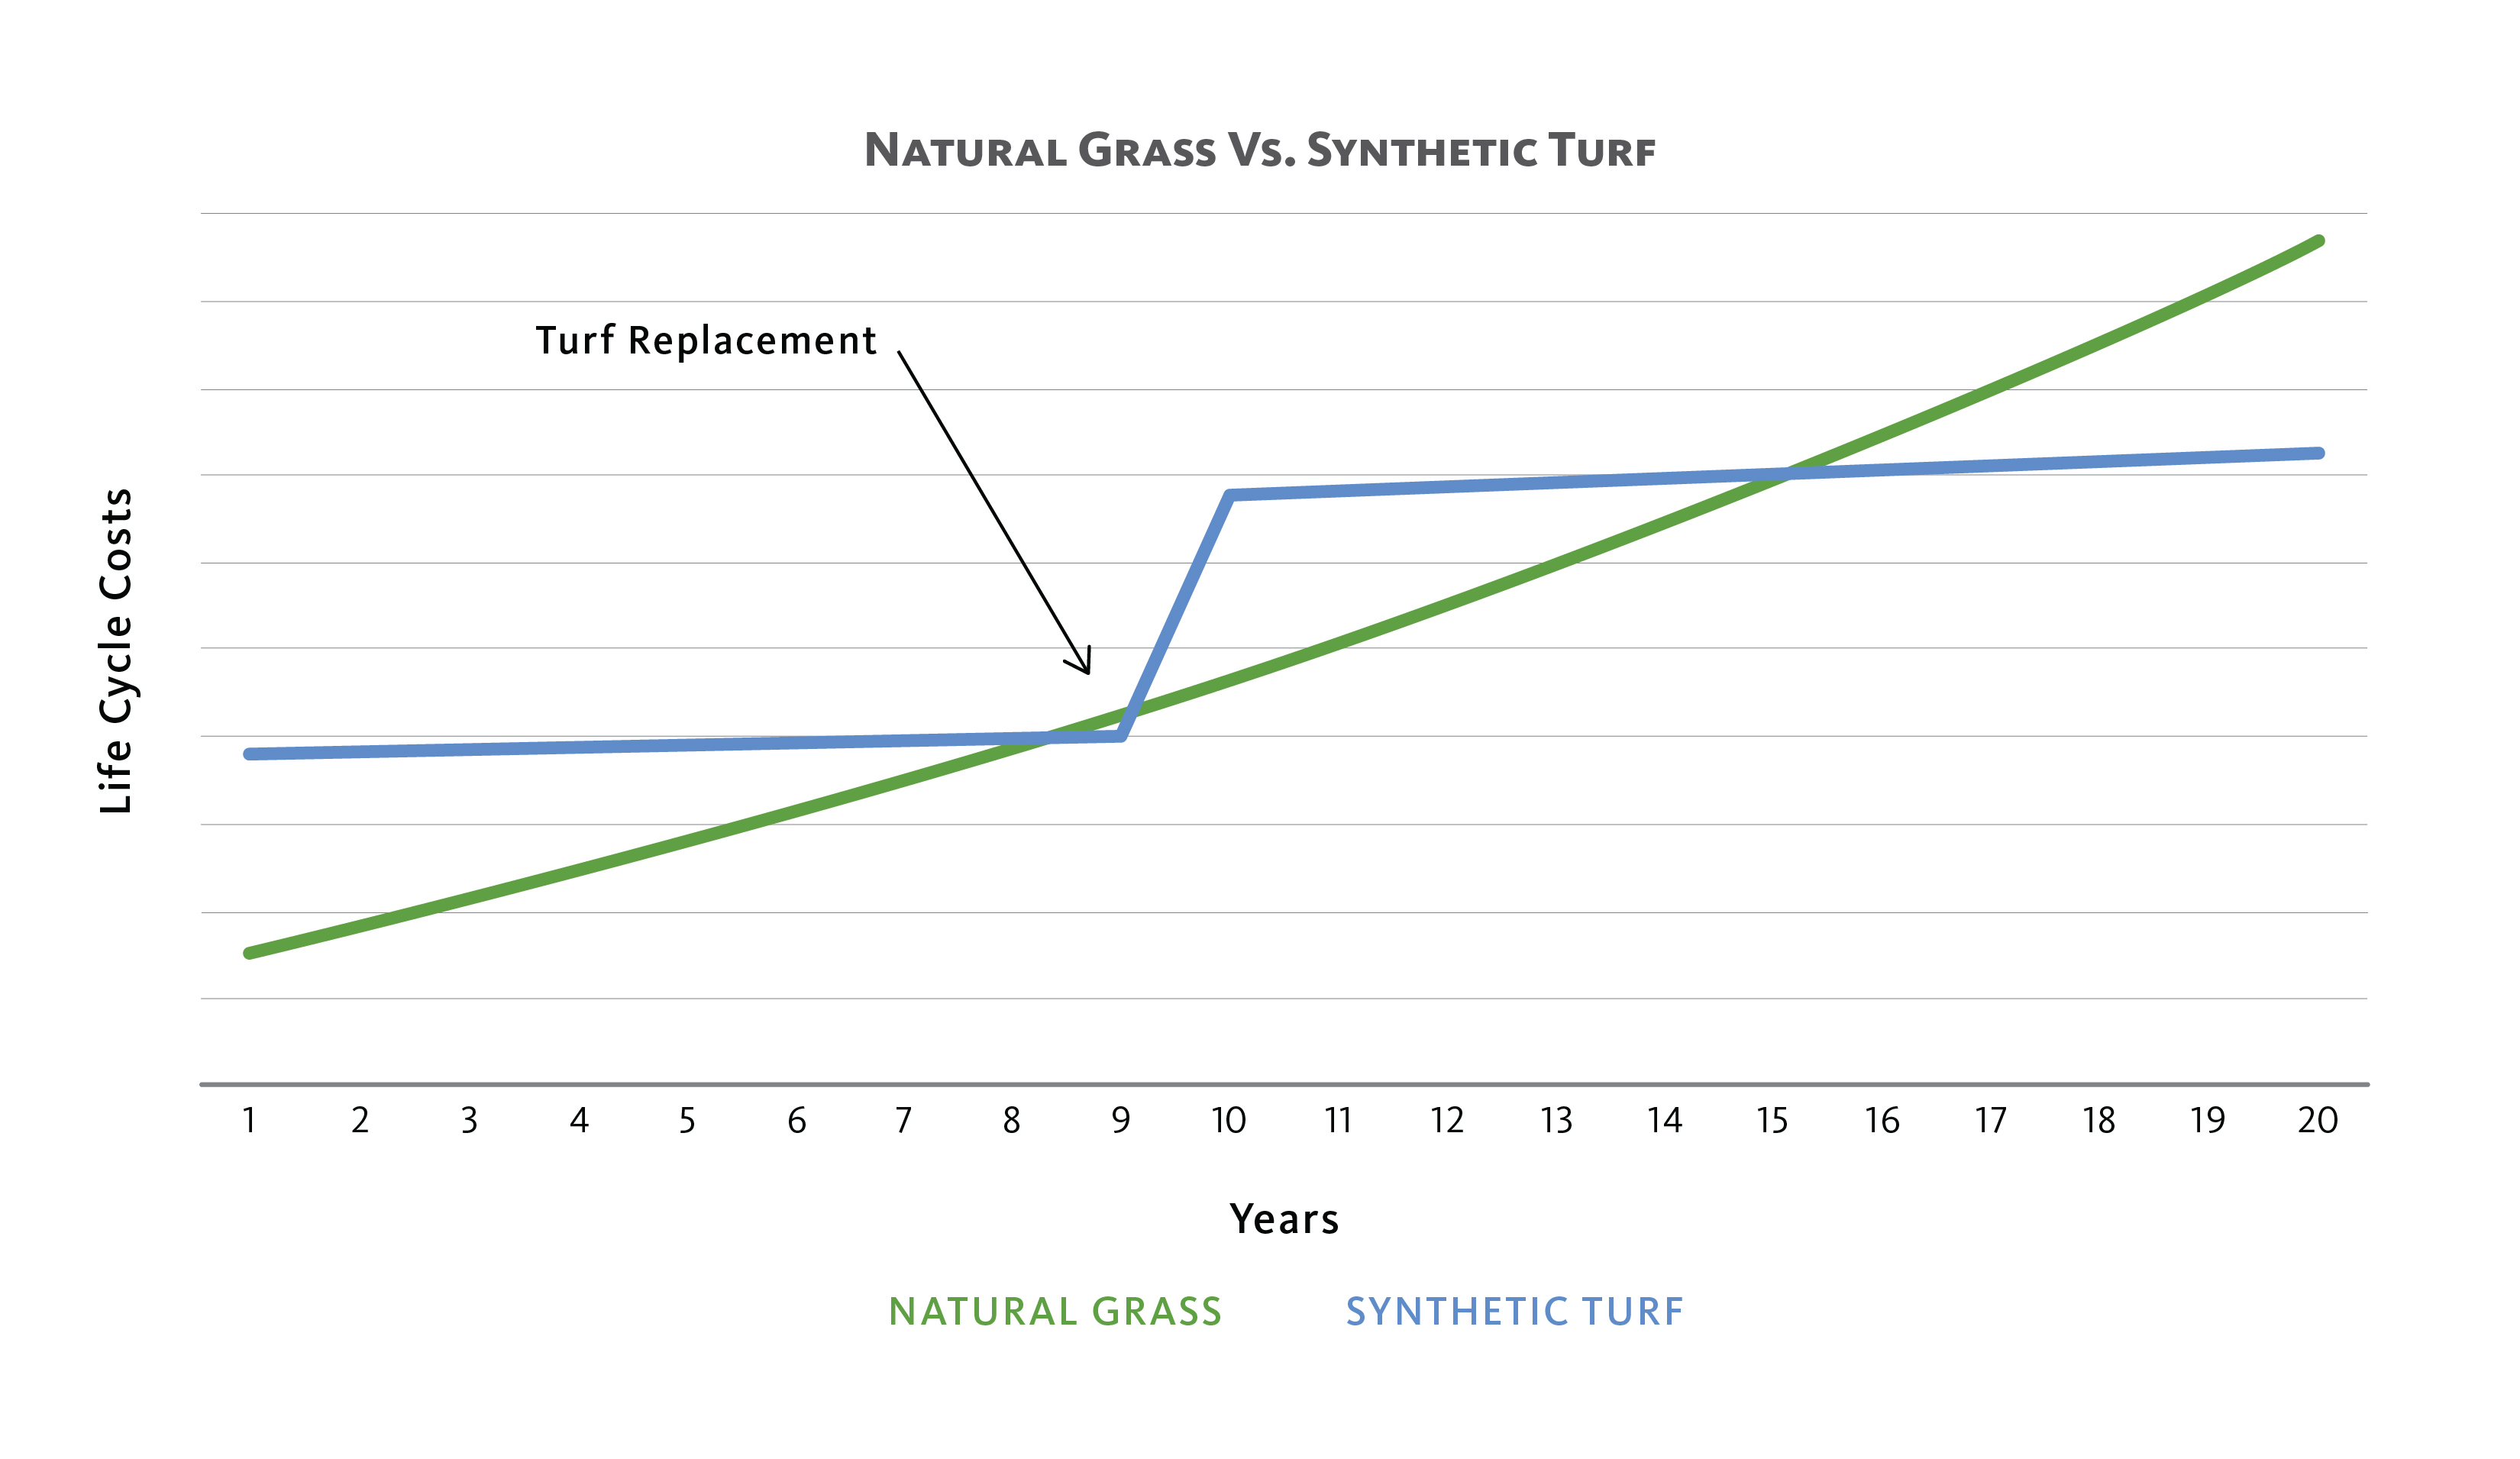 Figure 1 The above chart outlines the life-cycle costs of both natural grass and synthetic turf options, including initial expenditures and on-going maintenance costs.
Presented with these long-term costs, the OCMI team sought to understand the relative differences in potential revenue streams from non-student users. Again, our findings revealed a substantial advantage to artificial turf. Adjusted for declines during winter months, we found that the artificial turf could be rented an additional nine (9) hours per week versus grass, and at a higher hourly rate ($100/hour versus $70/hour).
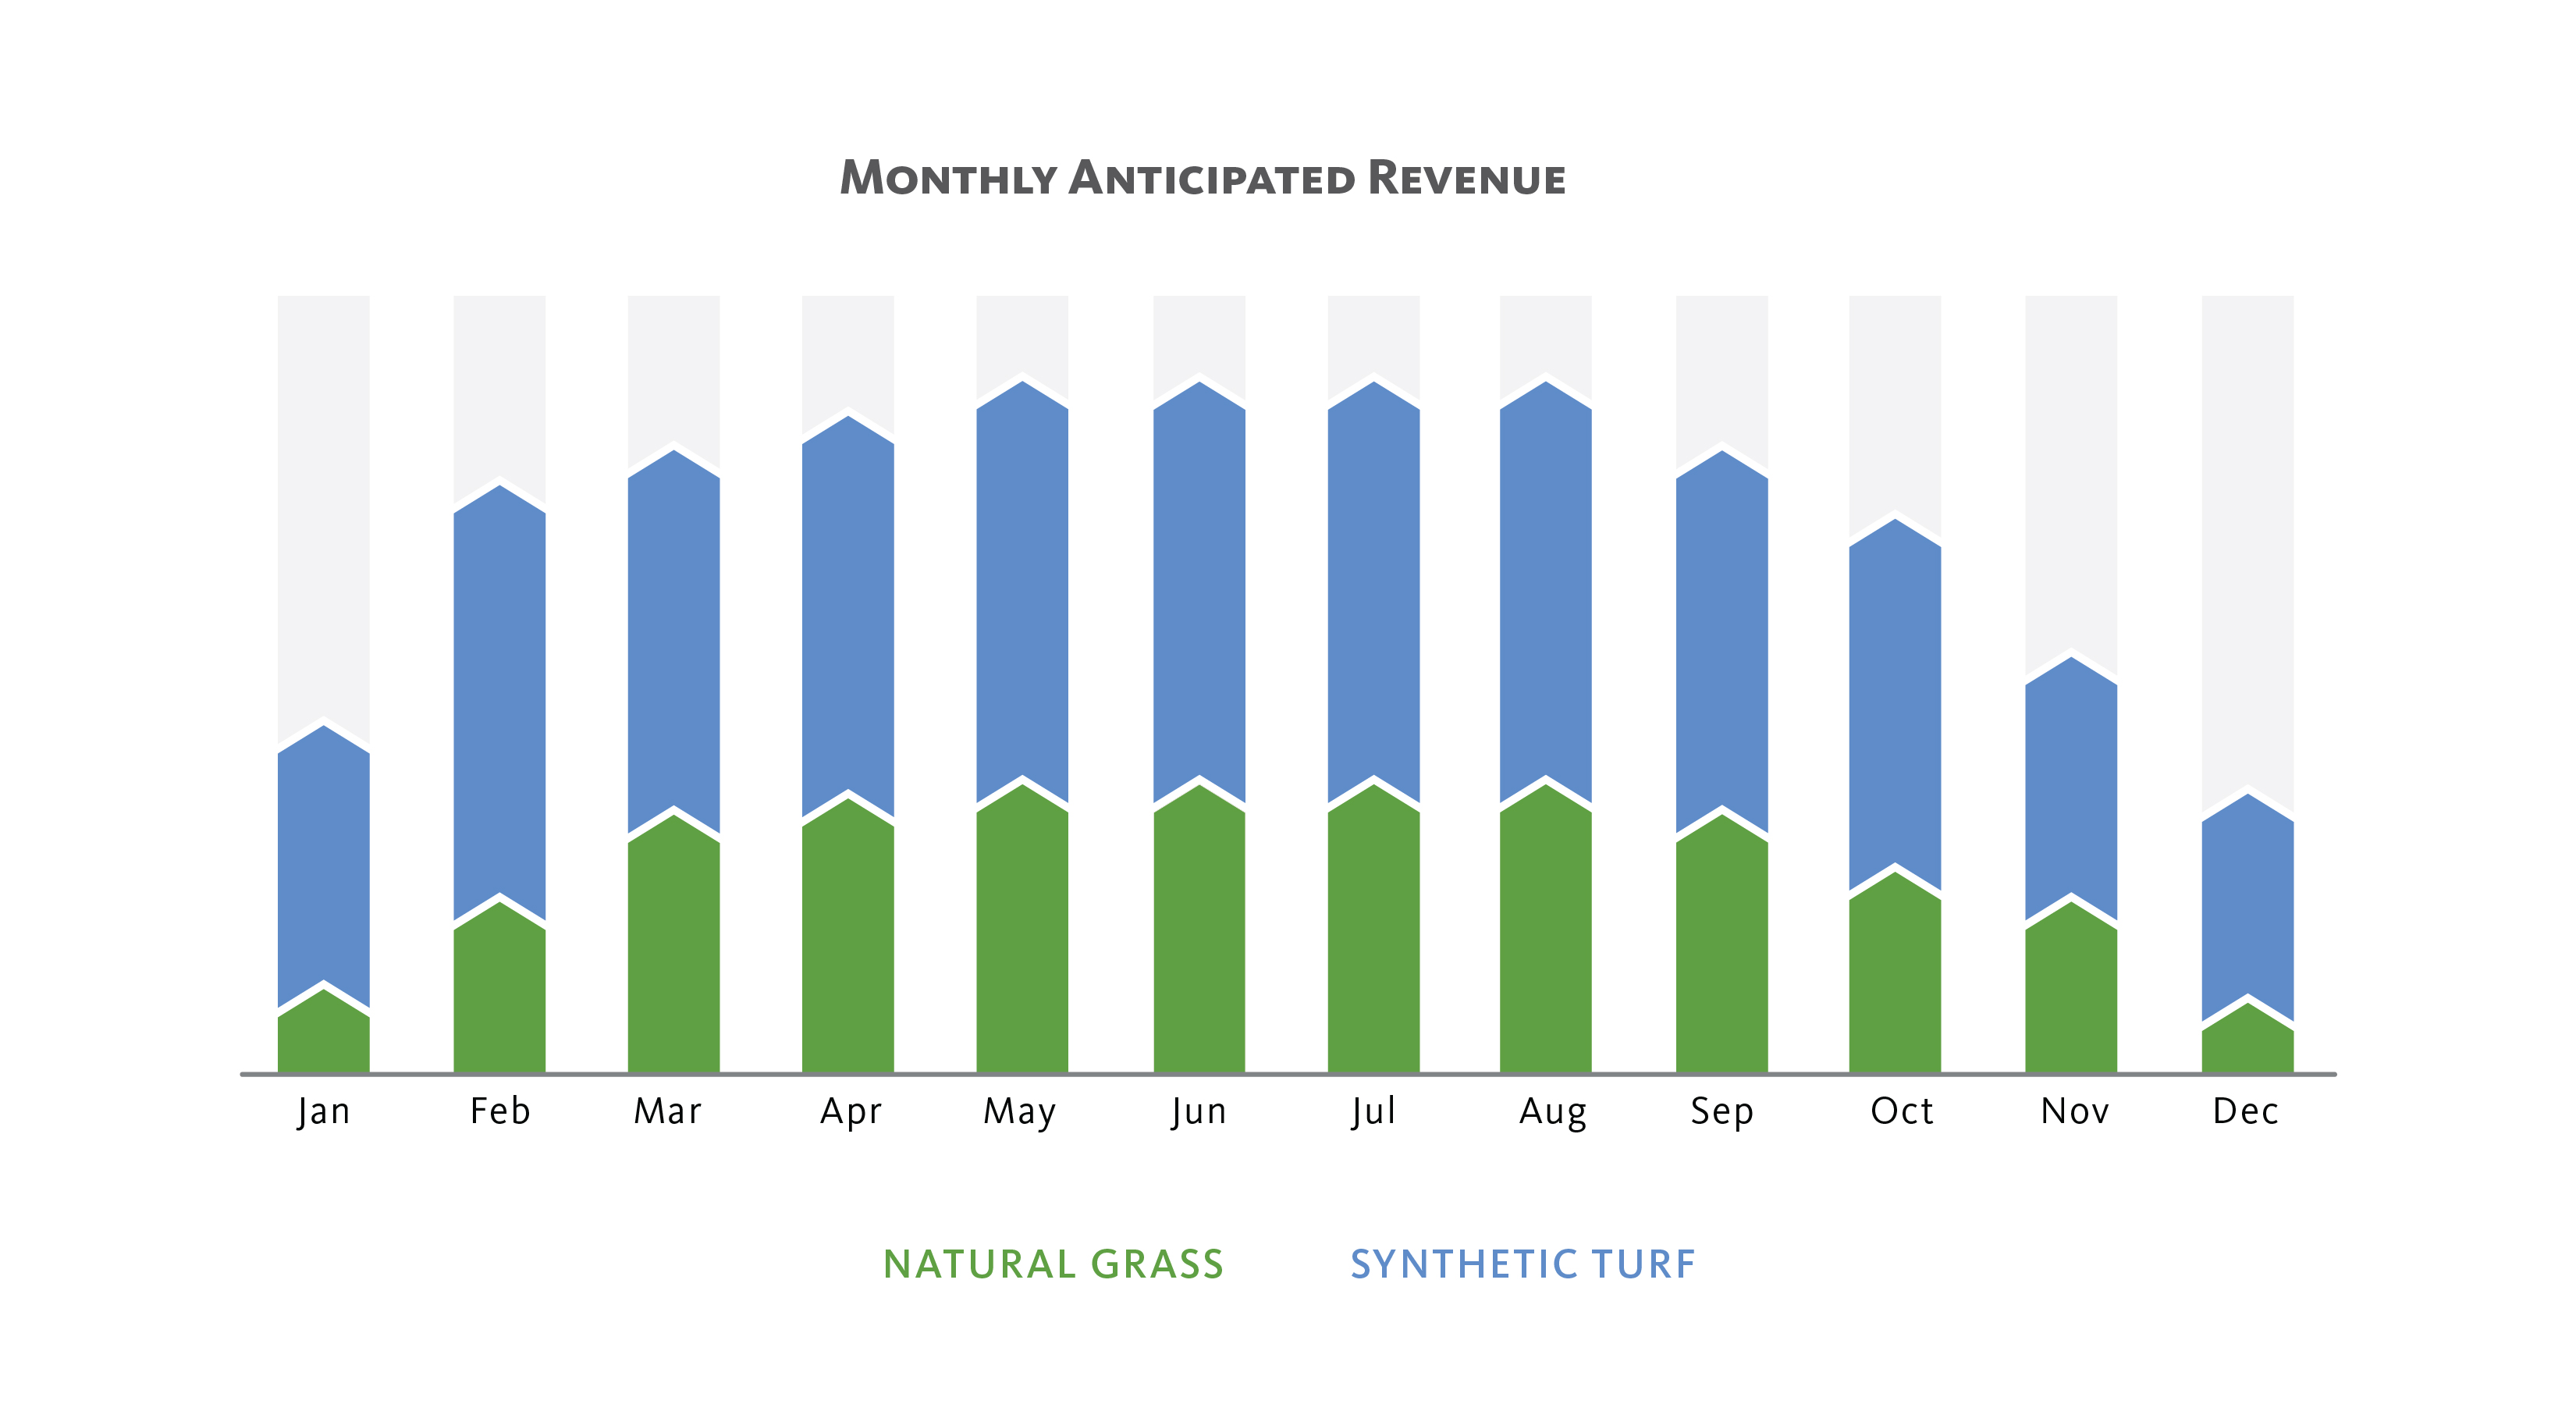 Figure 2 As outlined in the above graph, synthetic turf’s increased availability in terms of hours by week and higher hourly rent value combine to make it a potentially more lucrative revenue stream.
Combining these results revealed an optimistic cost-to-revenue break-even point of eight (8) years for artificial turf, whereas a natural grass field would experience continually rising maintenance costs and unlikely generate sufficient revenue to cover those costs.
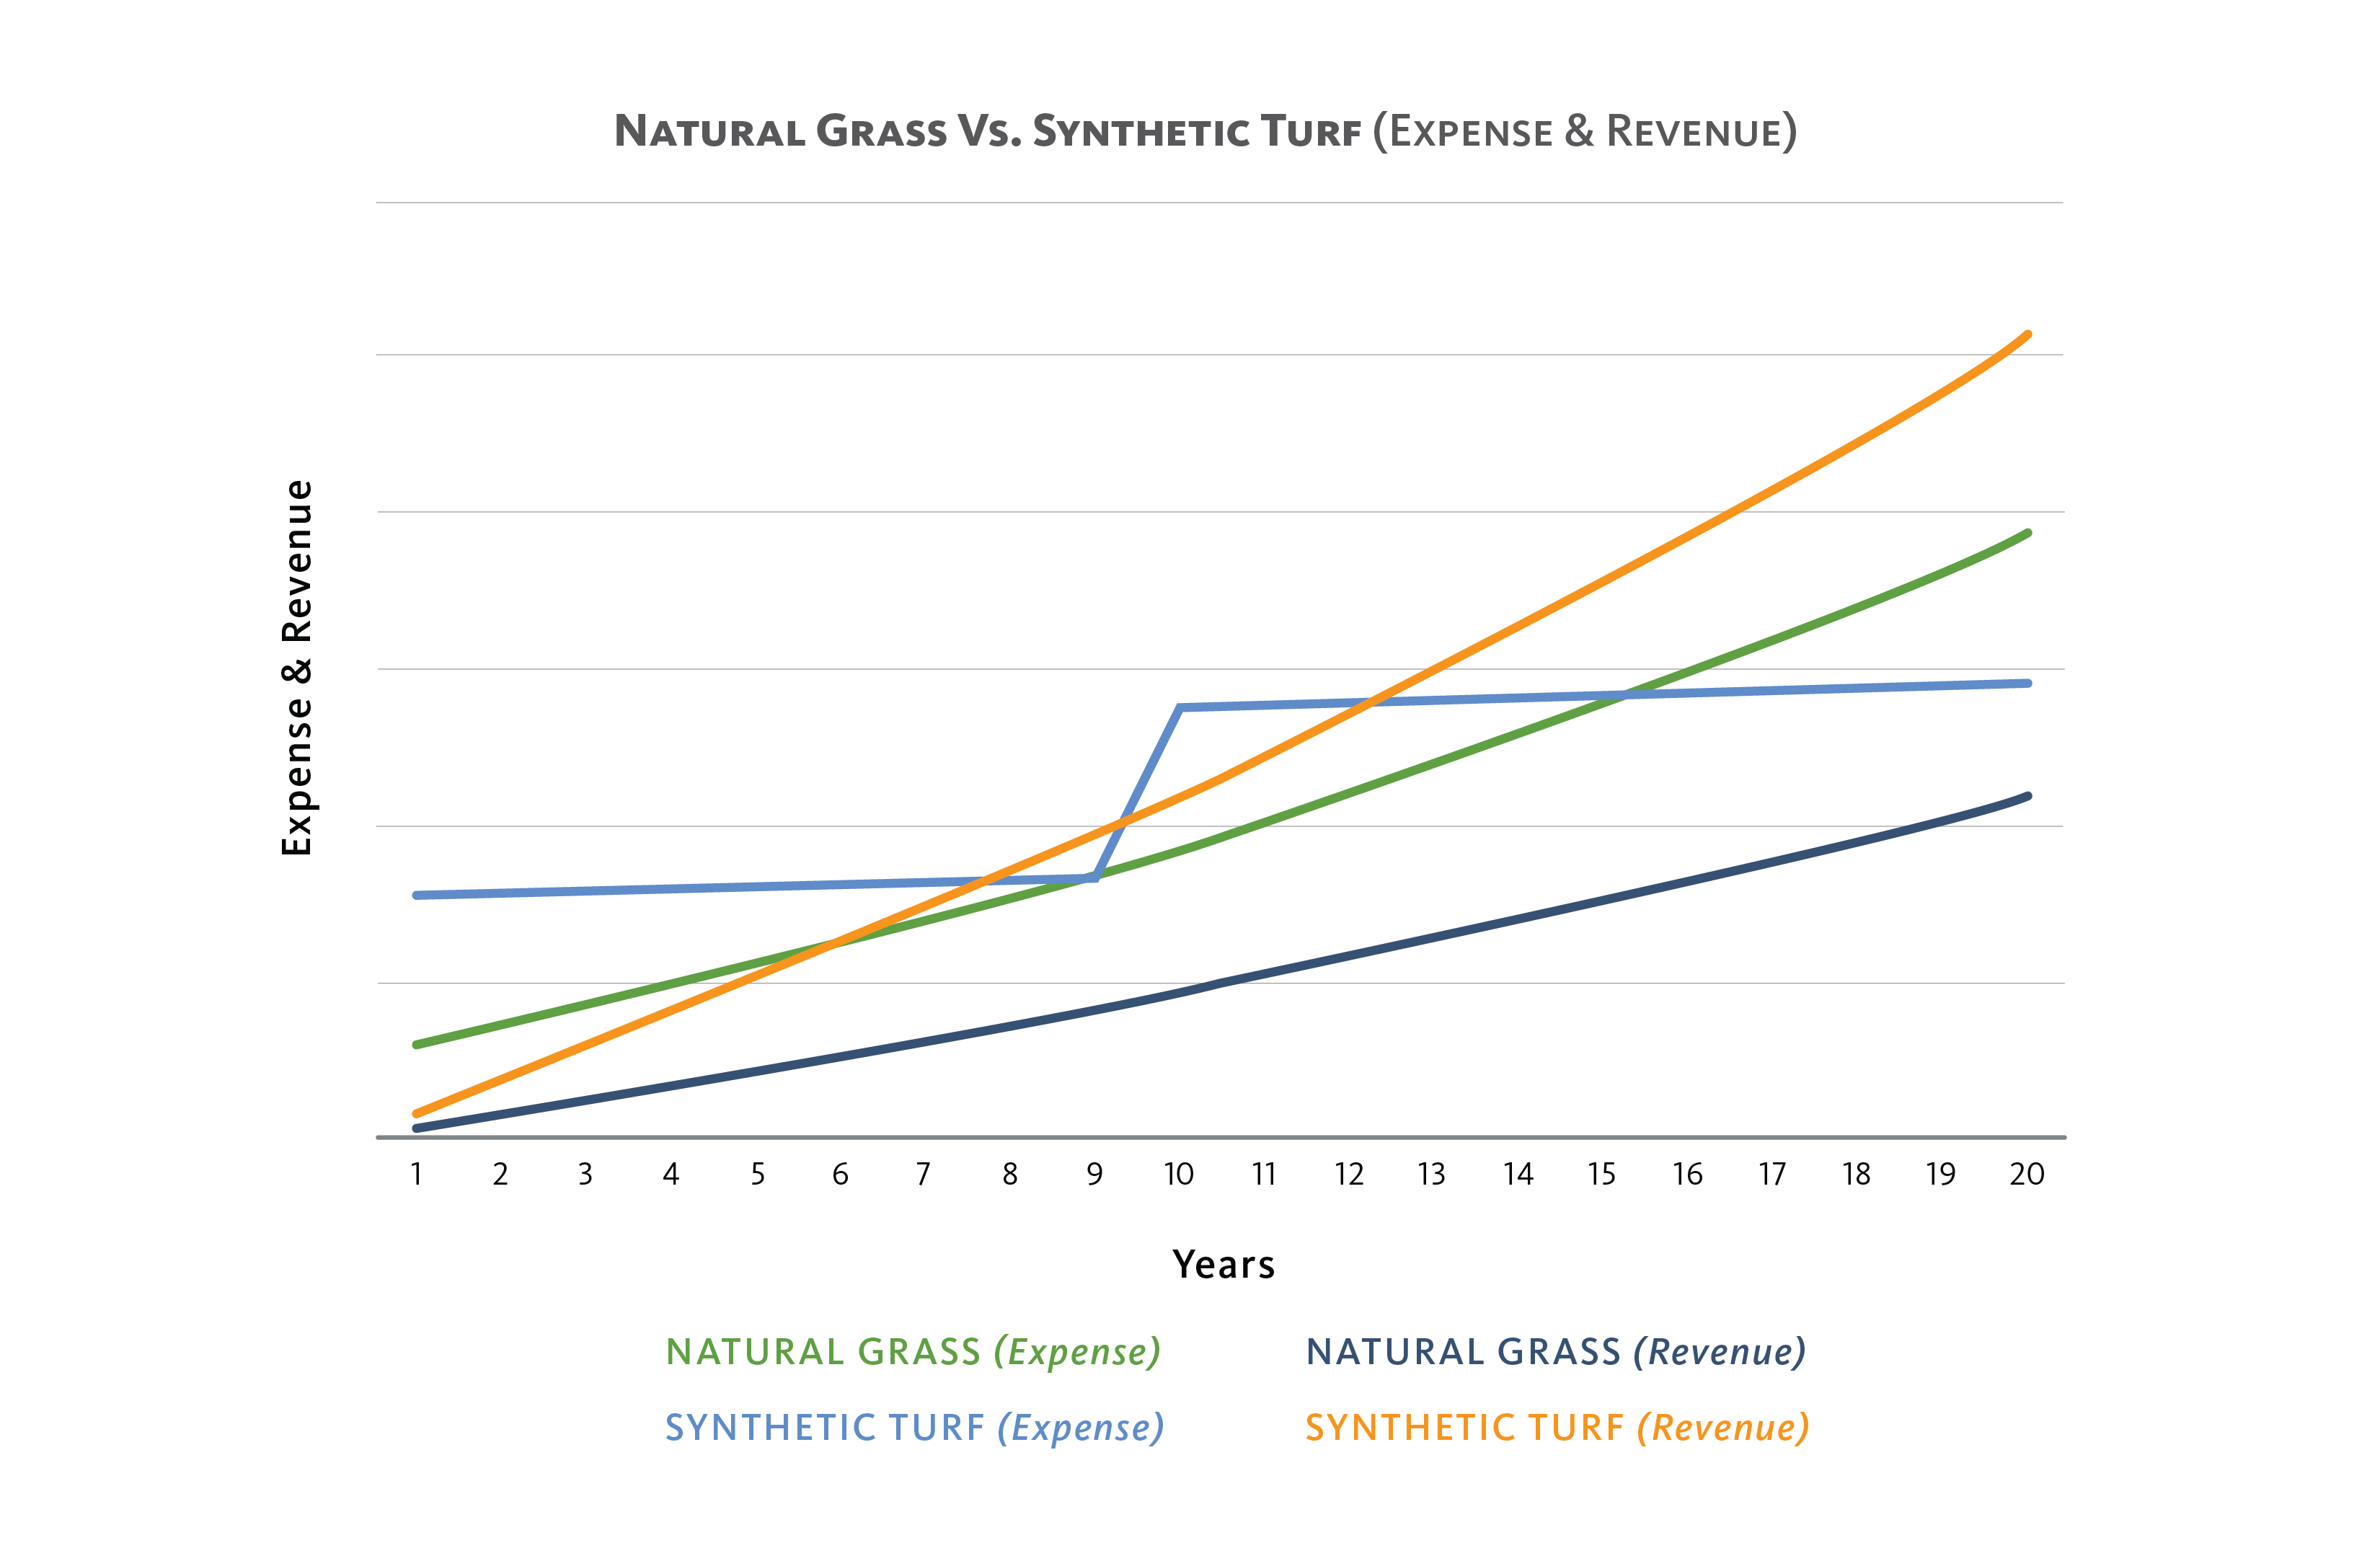 Figure 3 The final figure combines the data of the previous two graphs to highlight the disparity in revenue vs costs when comparing natural grass and synthetic turf.
OCMI’s study ultimately outlined a wider array of community engagement and capital investment options for our education client, allowing the school and the design team to make better informed decisions about the future of the school’s athletics facilities.